>Home
>
Products
> Software > ATS
Quality Manager >
ATS Quality Manager - Medium Case |
|
Walkthrough
in ATS Quality Manager
Feel
free to download workspace file at the bottom and open in FARO Scene.
Click on images to magnify/enlarge.
1.
Overview
On the overview
image (A) you can see that there are mostly green scans in this project
which is good, but there are still some yellow so it could be better.
There is only one scan which is red, and it would be good if we could
get it better than that. The average distance error of 1.5 mm is really
good.
Hovering over the pie chart indicates number of quadrants
occupied being the biggest problem. This is unfortunately often not
very easy to do anything about. The point drift indicated as second
most common error should be possible to handle though.
|
|
2.
Scans
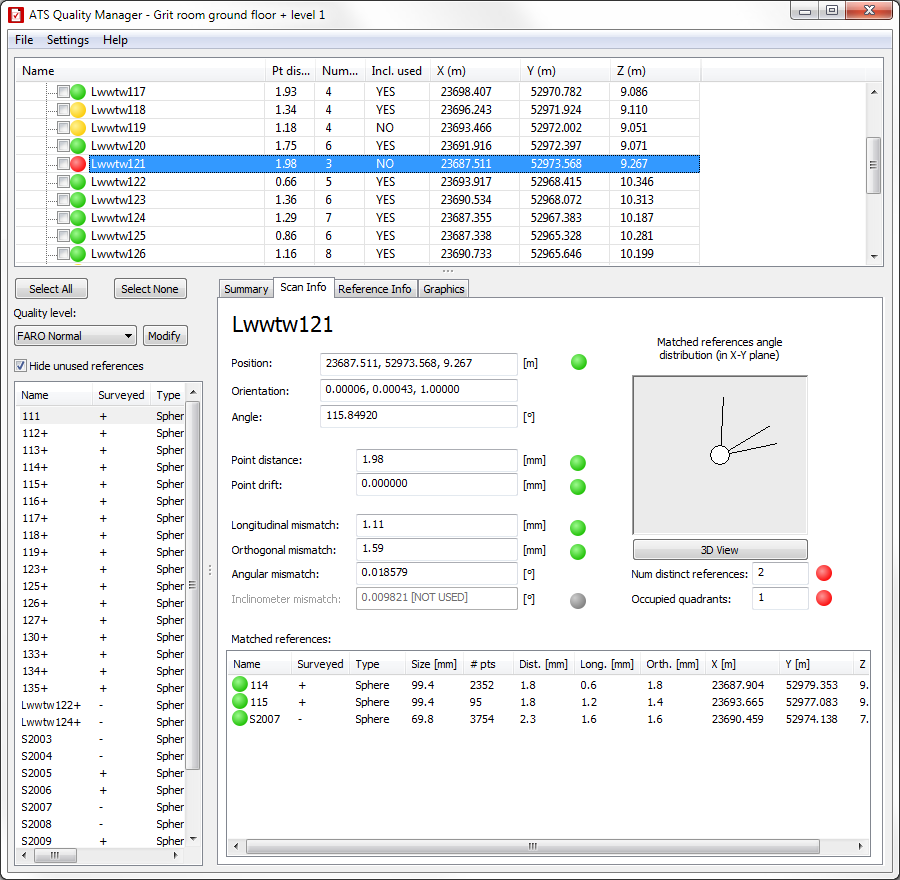
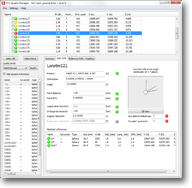
The
red scan is a good starting point. Looking at it (B) we see that the
red values come from a bad reference distribution. Fortunately though
it looks like the inclinometer wasn't used in this scan, so an easy
solution to the problem is to activate it. This will not make the scan
green, but will at least bring it up from red to yellow. The
inclinometer error is a bit higher than of other scans in the group,
but it's still well within the limits of good quality (had we used ATS
Detail for the quality level it would have been closer, but still
within the good limit).
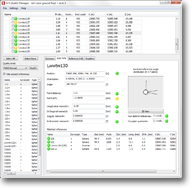
Looking at Lwwtw130 (C) instead we see
Point drift being the largest problem. It's a bit over the limit for a
good value, but by removing one of the references we might be able to
get it green. Although this risks putting us in yellow due to a bad
distribution instead. However we have 4 references for this scan but
only 3 distinct references, which means that one is too close to
another one to be of much use anyway (we can also see this in the
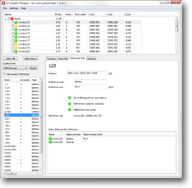
reference distribution graphic). Jumping to the 3D view (D) (by
clicking the "3D View" button) we can see that the two references that
are close to each other are 133 and S2012. 133 has the largest error
(2.3 mm) so removing this would probably improve the overall quality
without reducing the amount of distinct references, win-win.
If
we after this still have a too high point drift we could also "cheat"
and modify the upper limit for point drift (Settings > Quality
Thresholds...). This quality value is known to be a bit too
restrictive. A change to accomodate the point drift of Lwwtw130 would
probably not be a major problem and this would result in our scan now
becoming green. But of course it's better if it can be avoided by some
other means.
|
(B) Scan
Info
|
(C) Scan
Info
|
|
3.
References
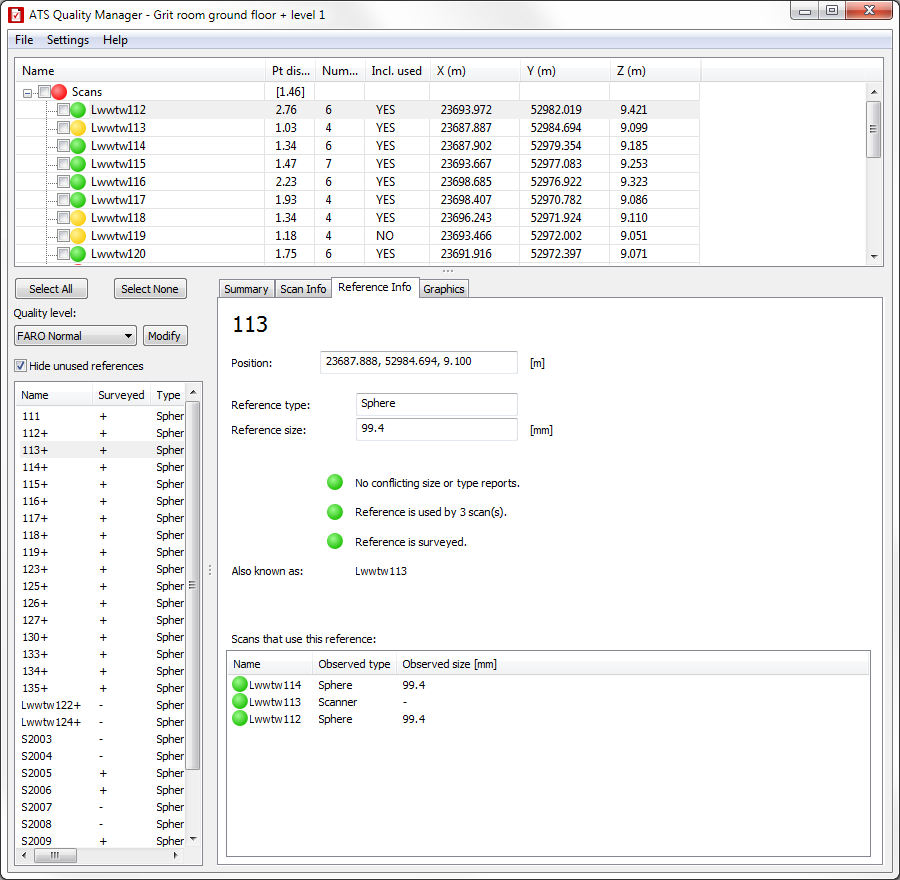
We
see that there are a lot of references known by more than one name (a
"+" sign after the reference name). If we look at the overview image
(A) we can see that 19 references has multiple names. This could
normally be a problem, but in this case we have a tunnel scan where the
position of each scan has been surveyed. Therefore those references
will always have two names; the name of the survey point and the name
of the scan which was made on that point. This is natural for SCENE and
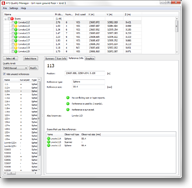
is no cause for concern. Reference 113 (E) is a good example showing
that it's the same as Scan Lwwtw113.
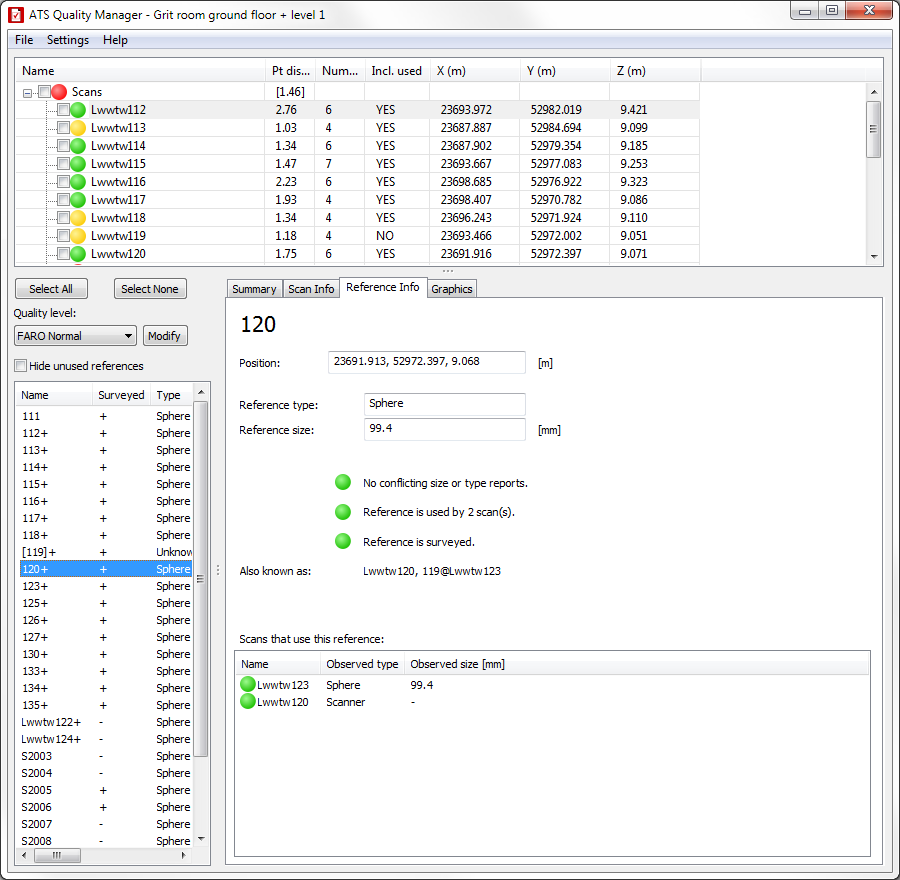
An interesting thing we
find if we go through all the references with more than one name is
that reference 120 is known by scan Lwwtw123 as 119. This is clearly
something that isn't quite right. Looking at the General tab for some
reference objects in SCENE we see that they all seem to be set to the
second alternative (Use for Place Scans and Correspondance Search).
This means their names won't be updated to what they are matched
against, which give us problems like this. It's recommended to always
use the topmost alternative (Use for Place Scans, Correspondance Search
and Automatic Name).
|
(D) Reference
Info
|
(E) Reference
Info
|
|
4. PDF Reports
Nothing special shows up in the pdf reports, we see what we already know from the program.
|
|
Downloads:
PDF: Compact Report
PDF: Full Report
Demo File: FARO Scene Workspace
|
|