>Home
>
Products
> Software > ATS
Quality Manager >
ATS Quality Manager - Good Case |
|
Walkthrough
in ATS Quality Manager
Feel
free to download workspace file at the bottom and open in FARO Scene.
Click on images to magnify/enlarge.
1.
Overview
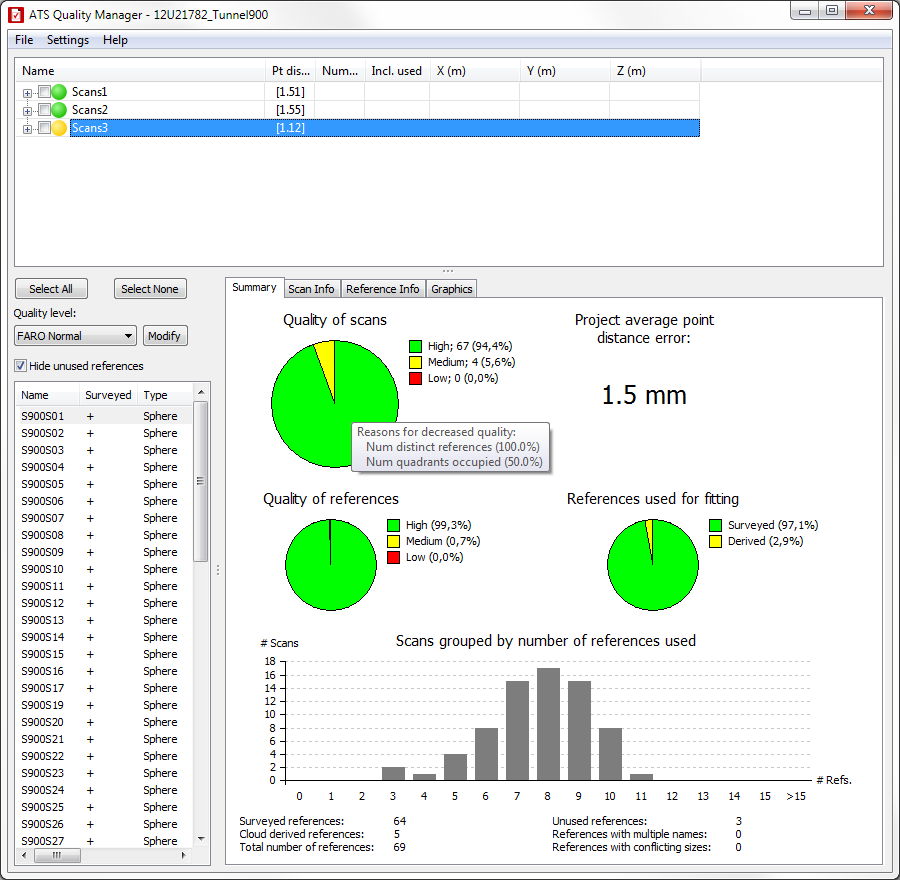
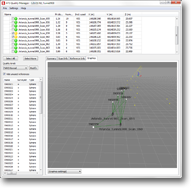
We have almost
only green scans on the overview image (A) and an average distance
error of just 1.5 mm. Only the last group (Scans3) contains any yellow
references, and even there it's only 4 scans (as can be seen in the pie
chart). The primary reason for the yellow scans is reference
distribution which unfortunately we can't do much about. We can check
how severe it is though.
|
|
2.
Scans
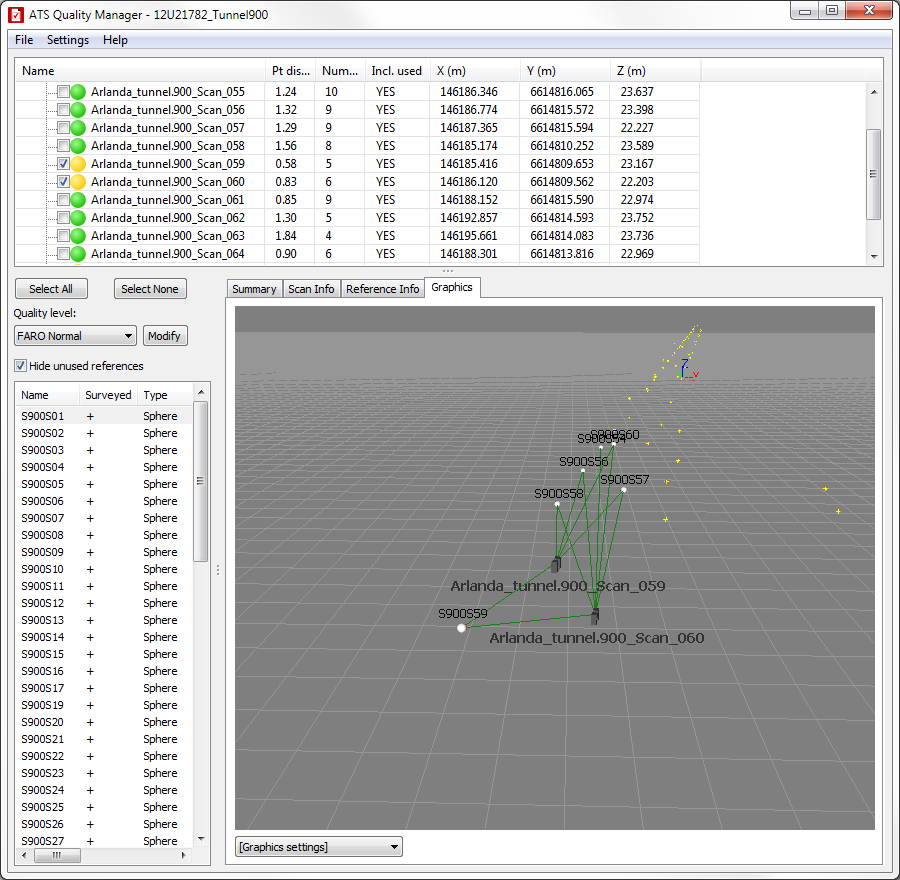
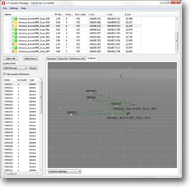
Looking
at scan 059 and 060 in picture B we see that they both are at the end
of the tunnel. This likely means that they are not as important as
other scans deeper inside the tunnel and we can accept the yellow
quality.
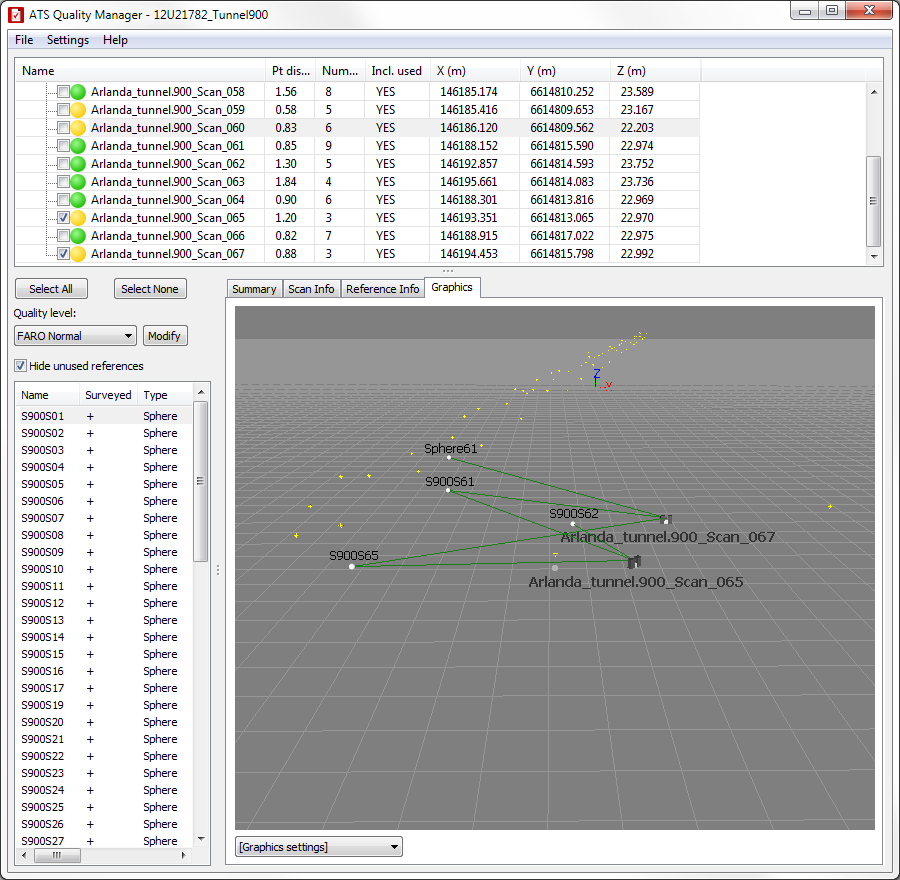
Looking instead at scan 065 and 067 we see that they
are inside a recess off the main tunnel. This is potentially more
interesting and hence the yellow quality is most unfortunate. There is
however a reference available to the far right in the image which would
be perfect to use to improve the reference distribution. The question
is why it isn't included. It might be hidden from view, but we can only
speculate without the scan data that goes with the workspace. If it was
visible though it would be highly beneficial to use it when placing the
scans.
|
(B) Scan
Info
|
(C) Scan
Info
|
|
3.
References
By
looking at the summary tab again (picture A), we can see that the
references are in very good condition. Only 5 of 69 are derived and
there are no references with multiple names or conflicting sizes.
|
|
4. PDF Reports
Nothing special shows up in the pdf reports, we see the good quality we already know from the program.
|
|
Downloads:
PDF: Compact Report
PDF: Full Report
Demo File: FARO Scene Workspace
|
|